What’s Behind the Rise in SNAP Participation?
- by Margaret Andrews and David Smallwood
- 3/1/2012
Highlights
- In 2011, nearly one in seven Americans received support from USDA's Supplemental Nutrition Assistance Program (SNAP).
- The number of Americans participating in SNAP is especially responsive to changes in the business cycle and, in turn, changes in need.
- Declining and persistently weak economic conditions have played a major role in the program's growth over the past decade, as have policy changes to SNAP that improved accessibility, expanded eligibility, and raised benefit levels.
In October 2011 46.2 million Americans were participating in USDA's Supplemental Nutrition Assistance Program (SNAP). Formerly known as the Food Stamp Program, SNAP increases the purchasing power of eligible, low-income people by providing them with monthly benefits to purchase food at authorized foodstores. Just 10 years earlier, participation stood at 17.3 million. What accounts for the growth of the program over the past decade?
There is little question that declining economic conditions are a major factor. The short 2001 recession was followed by a jobless recovery. Then, beginning in 2007, Americans experienced the most severe economic downturn since the Great Depression. In the second year of the 2007-09 recession, national unemployment averaged 9.3 percent, and 14.9 percent of Americans were living in poverty. In these times of weak economic growth and high unemployment, more individuals who were eligible for SNAP participated in the program. And, as funding for other public assistance has flattened, SNAP has increasingly become a mainstay for many low-income households.
But economic factors alone do not fully explain the growth in SNAP participation. Changes in SNAP policies, some of them associated with the 2002 and 2008 Farm Acts, have made benefits easier to apply for, available to more people, and more generous. Parsing out the relative effects of policy changes and macroeconomic conditions in a dynamic economy is difficult. Yet recent research has begun to paint a clearer picture of how some policy factors impact the program.
Changes in the Economy Affect the Number of Participants
SNAP benefits are Federally funded and tied to level of need. All people who meet the eligibility requirements are entitled to participate. Program expenditures fluctuate with changes in the number of people who apply and are eligible. Participants spend benefits rapidly, inducing positive impacts in the wider economy.
USDA's Food and Nutrition Service (FNS) administers the SNAP program, setting benefit amounts and establishing and overseeing program rules. States, through local welfare offices, are responsible for day-to-day operations; they determine eligibility, calculate benefits, and issue benefits to participants according to Federal rules. About half of the people receiving SNAP benefits in fiscal year (FY) 2010 were children, and 11 percent were elderly or disabled individuals living alone. In 30 percent of SNAP households, at least one member was employed.
The state of the economy has a direct effect on the numbers of families who qualify for SNAP benefits. As employment levels fall and incomes decline during recessions, the number of eligible people increases. With reduced incomes, households qualify for higher benefits, making participation in SNAP more attractive (see box, 'SNAP Provides Targeted Benefits Based on Need').
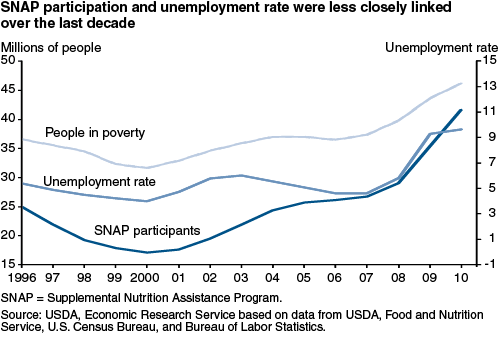
For most of the program's 40-year history, SNAP participation has tracked with the unemployment rate, rising as unemployment worsened and falling as employment picked up. ERS research has shown that since 1980, a 1-percentage-point increase in the national unemployment rate is associated with about 1 to 3 million additional SNAP participants. During the 2001 and 2007-09 recessions, changes in the SNAP caseload were consistent with this pattern.
The historical relationship between unemployment and SNAP caseloads diverged in the middle of the decade, however. As the unemployment rate fell 1.4 percentage points between 2003 and 2007, SNAP caseloads increased 22 percent, or by 4.8 million participants. The number of people in poverty rose by 4 percent, indicating that economic need remained high even as unemployment declined. The SNAP participation rate among eligible people also rose from 56 to 69 percent during this time.
Between 2007 and 2010, as unemployment rose from 4.6 to 9.6 percent, the SNAP caseload expanded by 56 percent, while the number of people in poverty increased by 26 percent. During the same period, the number of people in deep poverty (those with incomes below 50 percent of the poverty level) rose by 32 percent.
Welfare Reform Tightened Eligibility and Benefits
While the economy is recognized as the most important driver in SNAP participation, the history of SNAP over the past two decades illustrates how shifts in policy priorities can also influence program participation. During welfare reform in the mid-1990s, cash welfare underwent the greatest upheaval, but SNAP benefits were also reduced and eligibility tightened. Several years later, after large declines in SNAP participation, regulatory and legislative changes were enacted to expand SNAP and restore benefits to a larger share of the needy population.
In 1996, Congress passed the Personal Responsibility and Work Opportunity Reconciliation Act, shifting more policy authority for cash welfare from the Federal Government to the States. The old AFDC (Aid to Families with Dependent Children) program ended, and States were given block grants and tasked with implementing the program's replacement--Temporary Assistance for Needy Families (TANF). States were given wide latitude in developing their TANF programs, and many reallocated funds away from traditional cash welfare payment, using funds instead to support child care, workforce development, and family formation initiatives.
The 1996 Act made many changes in SNAP (then the Food Stamp Program) as well. The program remained a federally administered entitlement program, but the Act reduced benefit levels, limited eligibility for noncitizens and able-bodied adults without dependents, and generally complicated program administration.
Program access became an issue as States adjusted to the new environment. Unlike TANF, where eligibility procedures changed at State discretion, SNAP benefits remained closely targeted to need, and States continued to be held accountable if benefits were issued erroneously. Facing a high probability of being sanctioned, States increased their efforts to prevent eligibility errors following welfare reform. Applicants were required to undergo lengthy interviews about, and provide verification of, household income and assets.
For most applicants, information had to be obtained from third parties, such as employers or landlords. Some applicants received unscheduled home visits, and some were fingerprinted. An ERS-sponsored study found that in 2000, applicants who were ultimately approved for benefits spent an average of 6.1 hours on the process and were required to make an average of 2.4 trips to the SNAP office. Prior to welfare reform, applicants spent an average of 3.9 hours and 1.6 trips to be approved for participation.
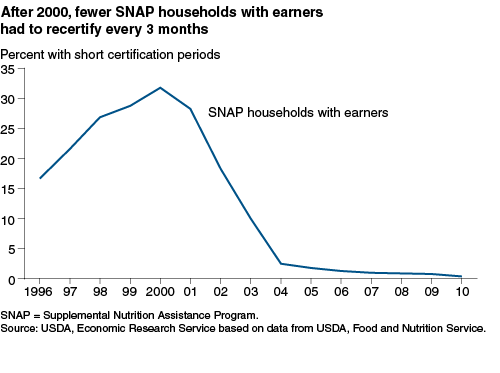
Another measure States took to reduce errors was to require households to reapply for benefits more frequently, particularly those households with employed adults. In 1996, 16.6 percent of working households were required to re-certify (that is, repeat the application process) every 3 months. By 2000, that number had nearly doubled to 31.8 percent. A 2003 ERS study estimated that increasing the portion of households subject to short certification periods (3 months or less) by 10 percentage points would lower the number of participating households by 2.7 percent.
In the years following welfare reform, SNAP caseloads fell 47 percent from 25 million people in 1996 to 17 million in 2000. Though the strong economy accounted for much of the decline in SNAP participation, evidence shows that policies that added burden to SNAP participation had an influence, as well.
Streamlining During the Past Decade Reduced Burden and Expanded Eligibility
Actions since 2000 have lessened the time and paperwork required to apply for and participate in SNAP. In addition, States were given more options to simplify and streamline their programs. Beginning with regulatory changes in 1999, the Federal guidance has been to encourage, but not require, States to make changes in how they implement the program's rules to make access to benefits easier.
The Farm Security and Rural Investment Act of 2002 (2002 Farm Act), along with several pieces of legislation in the early 2000s, reversed some of the changes enacted under welfare reform and gave States more flexibility in managing SNAP implementation. The 2002 Act restored benefits to most legal immigrants, simplified the treatment of income, expanded options to reduce participants' income reporting burden, and allocated funds for improving program access, participation, and outreach.
One of the most important policy changes was targeted toward reducing the time that participants spent reporting changes in income and household circumstances. The 'simplified reporting option' required States to certify households for at least 6 months and hold recipients accountable for only reporting to the SNAP office when their incomes exceeded 130 percent of the poverty line. By 2004, 33 States adopted this option, and the proportion of households with earned income subject to 3-month certification periods fell from 31.8 percent in 2000 to 2.5 percent in 2004. Econometric studies have confirmed a positive effect of these changes on SNAP caseloads.
Other policy changes relaxed eligibility standards. Eligibility for SNAP is determined using thresholds that consider both income and the value of assets such as bank accounts, cars, and other property (excluding the value of a home). The 2001 Agriculture Appropriations bill modified the rules regarding treatment of vehicles in asset determination--rules which in prior years had been highly restrictive, especially for working families. In 2008, the Farm Act exempted tax-deferred educational and retirement accounts from counting as assets to ensure that families experiencing temporary hardship need not deplete savings set aside for their future.
Recently, rules governing categorical eligibility have become more prominent in public discussion. Since 1985, households receiving cash assistance from the AFDC, TANF, Supplemental Security Income (SSI), or State General Assistance programs have been automatically eligible for SNAP benefits. With the transformation of AFDC to TANF, State standards differed widely and not all TANF benefits took the form of cash payments. In November 2000, USDA clarified that households authorized to receive non-cash or in-kind benefits such as child care or counseling through TANF are also categorically eligible for SNAP.
Over time, most States have adopted what has come to be called broad-based categorical eligibility standards, which make low-income households eligible for SNAP when they receive an informational pamphlet or other low-cost intervention produced with TANF funds. States using the broad-based option are also allowed to eliminate all assets from consideration in determining eligibility and to raise the gross income eligibility cutoff above 130 percent up to a maximum of 200 percent of the Federal poverty level. The broad-based option is attractive to State administrators because it reduces the time spent asking about and verifying assets and the administrative errors for which States are held accountable. Applicants also benefit by not having to provide documentation verifying their assets.
Delaware, Maine, North Dakota, and Oregon were early implementers of the broad-based option, and nine States were using it in 2002. Over the decade, more States adopted the option, especially after 2006. By FY 2010, 37 States had adopted the broad-based option, accounting for 84 percent of caseloads. Of these, only Texas and Minnesota did not completely eliminate the asset test, 20 States raised the gross income cutoff for eligibility above 130 percent of the Federal poverty level, and 3 States increased the gross income cutoff only for households with children.
While it is difficult to isolate the consequences of a particular policy change because so many factors are in play, an ERS-sponsored study simulating the effects of changes in the Federal asset limits estimated that in 2006, 7 percent of households were eligible only because of the expanded categorical eligibility rules. The researchers also estimated that completely eliminating the asset test--as has become the case in most States adopting the broad-based option--would increase the number of eligible households by a larger factor. However, the benefit levels of those made eligible by eliminating the asset rules tend to be lower than other participants because they are generally in a better financial position, and benefit levels remain subject to the same need-based formula. In addition, because of lower benefit levels, few made eligible by eliminating the asset rules will choose to participate in the program. Recent econometric studies estimate that SNAP caseloads increased by 6.2 percent in the year following implementation of the broad-based option, holding all other factors constant.
Benefits Raised in the Last Half of the Decade
The Food, Conservation, and Energy Act of 2008 (2008 Farm Act) changed the name of the Food Stamp Program to SNAP and included provisions projected to increase Federal spending on the program by $7.8 billion over 10 years. Support for working-poor families was enhanced by allowing larger deductions for child care. The Act raised the program's standard deduction and minimum benefit and included provisions to account for rising prices of food and other living costs by annually indexing the deduction and minimum benefits for inflation.
Indexation of the maximum benefit was not changed; the level is reset each October based on food prices for the previous June. This means that over the year, the real value of the benefit is eroded if food prices rise. For example, when food prices rose rapidly in 2007-08, the purchasing power of the SNAP maximum benefit fell by 9 percent because of the benefit adjustment lag.
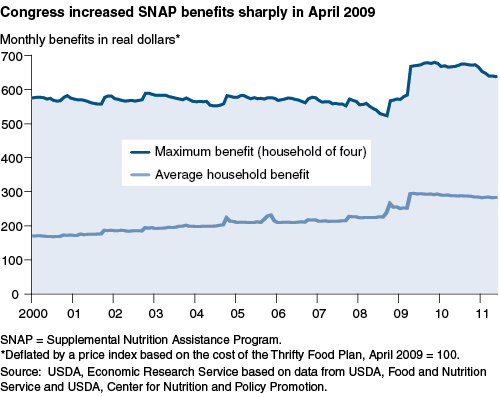
However, more substantial benefit changes were made by the American Recovery and Reinvestment Act of 2009 (ARRA)--temporary changes intended to assist those in need and to stimulate the economy. The benefit changes, initially structured to be phased out gradually as food prices rose, are now scheduled to expire completely in November 2013.
In April 2009, maximum benefit levels for SNAP were increased by 13.6 percent--the equivalent of $80 a month for a four-person household. Because the ARRA benefit increase was granted as a fixed-dollar amount for each household size, the changes were greatest, in percentage terms, for households eligible for the smallest benefits. A four-person household eligible for $20 in March 2009 would have most likely found itself eligible for a $100 benefit in April 2009. On average, SNAP households saw a $46 increase in their monthly benefits. ERS researchers found that the ARRA SNAP enhancements increased food spending by low-income households by 2.2 percent between 2009 and 2010, with a corresponding improvement in their food security.
SNAP Is Now a Greater Portion of the Safety Net
Over the past decade, the SNAP program has been modified to make it more accessible to working households and their participation has contributed to its rapid growth. Disabled and elderly households continue as stable components of the SNAP population. But households combining SNAP with cash welfare have declined. When welfare reform was enacted in 1996, about 37 percent of households getting SNAP benefits also received cash assistance and only 10 percent had no other source of income besides SNAP. In FY 2010, only 8 percent of SNAP households were receiving cash assistance and nearly 20 percent had no other source of income. In today's difficult economic climate, SNAP is increasingly becoming the mainstay for households with no other income sources.
This article is drawn from:
- Hanson, K. & Andrews, M. (2008). Rising Food Prices Take a Bite Out of Food Stamp Benefits. U.S. Department of Agriculture, Economic Research Service. EIB-41.
- Nord, M. & Prell, M. (2011). Food Security Improved Following the 2009 ARRA Increase in SNAP Benefits. U.S. Department of Agriculture, Economic Research Service. ERR-116.
- 'The Transformation of the Supplemental Nutrition Assistance Program'. (2011). Journal of Policy Analysis and Management. Vol. 30, Issue 4, pp. 863-888.
- 'Reporting Requirement and Asset Test Policies in the Supplemental Nutrition Assistance Program'. (2012). Journal of Economic and Social Measurement. Vol. 36. No. 4.
- How Unemployment Affects the Food Stamp Program. (2002). USDA, Economic Research Service. FANRR 26-7 .
- 'Short Recertification Periods in the U.S. Food Stamp Program'. (2003). The Journal of Human Resources. Vol. 38, Special Issue on Income Volatility and Implications for Food Assistance Programs, pp. 1112-1138..
- Simulated Effects of Changes to State and Federal Asset Eligibility Policies for the Food Stamp Program. (2008). Contractor and Cooperator Report No. 49. Contractor and Cooperator Report No. 49.
- Food Stamp Program Access Study. (2004). Economic Research Service. Food Stamp Access Study, by Susan Bartlett, Nancy Burstein, Vivian Gabor, William Hamilton, and others, EFAN 03013-3, November 2004..
You may also like:
- Young, E. (2008). The 2002 Farm Bill: Provisions and Economic Implications. U.S. Department of Agriculture, Economic Research Service. AP-022.


