Where Schools Are Located Affects Meal Costs
- by Michael Ollinger and Joanne Guthrie
- 6/16/2011
Across America, over 42 million meals--31 million lunches and 11 million breakfasts--are served on a typical school day through the National School Lunch and School Breakfast Programs. Under these programs, USDA reimburses school food authorities (SFAs) for meals that are expected to meet Federal nutrition standards. Reimbursement rates depend on whether the meal is a lunch or breakfast and the student is certified to receive a free, reduced-price, or full-price meal. With the exception of Alaska and Hawaii, reimbursement rates do not vary based on geography.
It is challenging for SFAs to serve appealing, healthful meals while covering food, labor, and other operating costs. But is this cost challenge more difficult for SFAs in rural or urban areas or in certain regions of the country? An ERS analysis of data on school meal costs from a large, nationally representative sample reveals that where an SFA is located can affect meal costs.
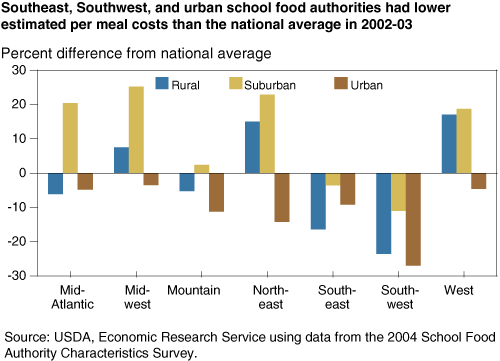
In the 2002-03 school year, after controlling for other factors, SFAs' per meal costs in the Southeast and Southwest regions averaged consistently below per meal costs in other regions. In the Southeast, lower food costs accounted for much of the difference, while in the Southwest, lower labor costs had more of an impact. Urban locations, on average, had lower per meal costs than their rural and suburban counterparts, primarily due to lower food costs. These urban SFAs also benefited from the lower per meal labor costs derived from their large size.
An SFA is the administering unit for the operation of a school feeding program. An SFA can be a school district, several school districts, or an individual school. ERS researchers used data from 1,432 SFAs that participated in the 2004 School Food Authority Characteristics Survey to measure the effects of location on school foodservice costs. The SFAs provided information on wages and salaries for kitchen workers, supervisors, and cooks; food costs, which include both purchased food and the value of federally provided commodities; and expenses for nonfood supplies, such as trays, napkins, and cleaning supplies.
The researchers employed a flexible economic model that controlled for a number of SFA characteristics that might influence cost, such as the total number of meals served and the mix of lunches and breakfasts served. This approach allowed the researchers to separate the effects of location from other factors that influence cost.
This article is drawn from:
- Ollinger, M., Ralston, K. & Guthrie, J. (2011). School Foodservice Costs: Location Matters. U.S. Department of Agriculture, Economic Research Service. ERR-117.


