Changing Farming Practices Accompany Major Shifts in Farm Structure
- by Erik O'Donoghue, James M. MacDonald, Utpal Vasavada and Patrick Sullivan
- 12/1/2011
Highlights
- Over the past three decades, the number of farming operations has remained relatively steady, but production has shifted to larger farms.
- Changes in production and marketing practices have facilitated—and have been facilitated by—organizational and distributional changes in agricultural production.
- Resulting changes in agricultural productivity helped keep prices for agricultural goods relatively low and reduced the environmental footprint for each unit of agricultural output produced, but not without tradeoffs.
For the past three decades, the number of U.S. farms has remained fairly stable at about 2.2 million, while the amount of farmland declined about 8 percent between 1982 and 2007. However, this relative stability masks major shifts in the distribution of production and significant growth in the amount of goods and services produced by the agricultural sector. The number of very large farms (those with over $500,000 in inflation-adjusted annual sales) has grown (see box below, "Concentration of Agricultural Production Has Increased Since 1987"). Large farms' share of agricultural production has increased, while the number and market share of all other farms except for the smallest (those with annual sales under $10,000) has declined (see "U.S. Farm Structure: Declining—But Persistent—Small Commercial Farms" in the September 2010 issue of Amber Waves).
Concentration of Agricultural Production Has Increased Since 1987
Because of the large and growing number of small farms in the U.S. that produce very little in a typical year, statistics on the average level of production per farm may not be very informative. For many commodities, the number of both very large and very small farms is growing—a fact obscured by relatively steady average production levels. A clearer picture of the increasing concentration of production on larger farms can be seen by looking at the farm size for which half of all acres harvested (or animals raised) are on larger farms and half are on smaller farms, referred to as the mid-aggregate enterprise size. For example, in 1987, half of all hogs were produced on farms that sold 1,200 head or more. By 2007, half of all hogs sold were from farms that produced 30,000 head or more—an increase of 2,400 percent over 20 years. While the increasing concentration of hog production on larger farms may be an extreme example, increasing mid-aggregate sizes were also observed for other livestock and poultry products, all the major field crops, and many other commodities.
| Selected commodity | Census year 1987 | Census year 1992 | Census year 1997 | Census year 2002 | Census year 2007 | Change, 1987 to 2007 |
|
|---|---|---|---|---|---|---|---|
| Animal products (head per farm)1 | (percent) | ||||||
| Broilers | 300,000 | 384,000 | 480,000 | 520,000 | 681,600 | 127 | |
| Hogs | 1,200 | 1,880 | 11,000 | 23,400 | 30,000 | 2,400 | |
| Fattened cattle | 17,532 | 23,891 | 38,000 | 34,494 | 35,000 | 100 | |
| Dairy production | 80 | 100 | 140 | 275 | 570 | 613 | |
| Field crops (acres harvested per farm) | (percent) | ||||||
| Corn | 200 | 300 | 350 | 450 | 600 | 200 | |
| Soybeans | 243 | 300 | 380 | 480 | 490 | 102 | |
| Wheat | 404 | 562 | 693 | 784 | 910 | 125 | |
| Cotton | 450 | 605 | 800 | 920 | 1,090 | 142 | |
| Rice | 295 | 400 | 494 | 607 | 700 | 137 | |
| 1Half of all animals sold came from farms selling more than the mid-aggregate, and half came from farms selling less. Half of all dairy cows were on farms with larger herds than the mid-aggregate, and half were on farms with smaller herds. For crops, half of harvested acres were from farms with more than the mid-aggregate acreage, and half were from farms with smaller acreage. Source: USDA, Economic Research Service, compiled from Census of Agriculture data. |
|||||||
At the same time, U.S. agricultural output has continued to grow rapidly, even as the amount of land and labor devoted to farming has declined (see "Is U.S. Agricultural Productivity Growth Slowing?" in the September 2010 issue of Amber Waves). In response to changing market conditions, technologies, public policies, and a host of other factors, farmers, particularly those operating larger commercial-sized farms, have adjusted production practices in numerous ways to remain competitive.
U.S agriculture provides food and fiber for growing domestic and international markets, supplies the feedstock for an expanding bioenergy sector, and provides ecosystem services such as carbon sequestration to a nation increasingly concerned with the environment. Without the productivity growth embodied in more advanced farming practices, meeting the increased demand for agricultural goods and services would require expanded use of marginal land, thereby raising the cost of agricultural production, both in terms of market prices and environmental degradation.
Nonetheless, changing farming practices can have both positive and negative effects. For example, the introduction of genetically engineered (GE) seeds, wider adoption of irrigation, and growth in contract sales have allowed farm operators to diminish the intensity of soil tillage, reduce weather-related risks, and lower production costs through increased specialization. But widespread adoption of GE plants is viewed with concern by some consumers, by farmers experiencing weed resistance to herbicides, and by nearby farmers specializing in organic crop production. Wider adoption of irrigation can reduce the availability of water for other uses and has implications for pesticide and fertilizer runoff. Increased contracting can leave some farmers worried about price fixing and can increase their risk if the contractor defaults. Moreover, the geographic consolidation of larger livestock operations has heightened localized concerns about the handling of manure and its environmental consequences.
Changing Practices Contribute to Larger Farms, Greater Use of Production Contracts
The increasing dominance of confined animal feeding operations for many types of livestock and a growing reliance on production contracts have contributed to the growth of large, specialized poultry, hog, and dairy operations. While confined animal operations are not new, their use in livestock farming has been increasing. Changes in the relative prices of land, labor, and capital over the past three decades may have encouraged the substitution of cheaper capital (in the form of more mechanized animal housing, feeding, and manure management facilities) for more expensive land and labor. Furthermore, capital-intensive operations often find that increases in farm size can lower the cost of production per animal, leading to consolidation of production on larger operations. In contrast, the labor and management requirements of operations that raise animals under less confined conditions limit the potential growth of such operations.
Historically, most agricultural products have been bought and sold for immediate delivery (through 'spot markets'), but a growing share of U.S. farm output is produced and sold under agricultural contracts that govern how and when commodities change hands. In 2008, contracts covered nearly 40 percent of the total value of agricultural production, up from 11 percent in 1969. Production contracts (where the contractor owns the commodity and pays the farm operator to raise it) are widely used in livestock production, while marketing contracts (where the farmer retains ownership of the commodity but promises future delivery to the contractor) are used for many crops.
Product differentiation, quality control, and the need to ensure a ready supply for processing facilities are key reasons why contractors prefer production and marketing contracts over spot markets. Production contracts are particularly prevalent in the poultry and hog sectors, accounting for 90 and 68 percent of production, respectively, in 2008.
Producers also enjoy multiple benefits from using contracts. Contracts allow them to focus on one production stage while not having to worry about other aspects of the agribusiness, such as marketing or feed formulation. This frees farm labor, enabling producers to increase production of the contracted commodity (that is, grow in size) or to diversify by growing other commodities or pursuing off-farm work. Moreover, producers with contracts enjoy better access to capital markets, allowing them to carry more debt—and therefore more capital—given their net worth than producers without contracts. Additionally, contracts ensure an outlet for their product and reduce or eliminate price risk for both the farm's output and for farm inputs provided by the contractor.
Changes in marketing arrangements, like other technological developments, have had a pronounced impact on farm sector productivity and structure. By reducing price risk, rewarding contract farmers for increasing production efficiency, and allowing farmers to become more specialized, contract sales have encouraged increased capital investments on large farms and further consolidation of production. Depending on the terms of the contract, they can also encourage the adoption of certain farming practices (for example, by requiring more stringent food safety practices) and require that housing and equipment meet minimum specifications, thereby weeding out less efficient operators over time.
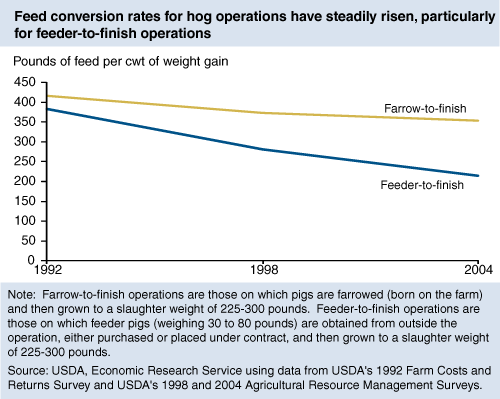
One example of the impact of production contracts on efficiency is the increasing feed conversion rate among hog producers. The average quantity of feed required per hundredweight of gain declined 44 percent for feeder-to-finish hog operations between 1992 and 2004. Most feeder-to-finish operations operate under production contracts. Since contractors typically bear the cost of supplying feeder pigs and feed to the farming operation, they have a strong incentive to invest in genetic improvements in the animals and improved formulations to reduce feed costs. And since contracts allow farmers to specialize in the grow-out phase of the production process, they have adopted practices that further increase feed efficiency, such as grouping pigs by age and weight so feed rations can be formulated for each pig's specific needs. In contrast, the average feed conversion rate on farrow-to-finish hog operations—which are less likely to have production contracts and are less specialized—declined by only 15 percent in 1992-2004.
While production contracts have boosted the productivity of livestock producers, they also limit a farm operator's management options and can leave farmers who are heavily invested in specialized housing and equipment dependent on a single buyer. The concentration of market power in the hands of one or two contractors—particularly for products with a short shelf-life or a limited geographic market—can handicap farmers in negotiations and magnify their risk from contractor default. And while feed conversion efficiency has reduced the amount of waste produced by each animal, the geographic concentration of production encouraged by contracts may have led to localized and intensified environmental risks in specific areas.
Labor-Saving Innovations Help Crop Farmers Expand Their Operations
While agricultural contracts are less prevalent among crop farms, they are very important for specific commodities, such as sugar beets, tobacco, and peanuts, and their use has increased over time for most other commodities. When contracts are used in crop farming, they are almost always marketing contracts used by larger operations. But aside from their long-term impacts through reduced price risk, crop marketing contracts do not appear to provide the same push toward concentration that has occurred in the poultry and hog industries. To the extent that management time prevents crop farm operators from expanding their operations, other technological advances (such as improved equipment) that reduce management requirements can ease this constraint, enabling farmers to expand and consolidate.
Improved farm equipment has enabled farmers to increase the size of their crop farms. For example, in 1970, an operator could plant 40 acres of row crops and harvest 4,000 bushels per day. By 2005, a producer could plant 420 acres and harvest 30,000 bushels in a single day. Consolidation trends have continued through the adoption of further labor-saving innovations, such as GE seed varieties, which have improved the efficiency of crop farm management.
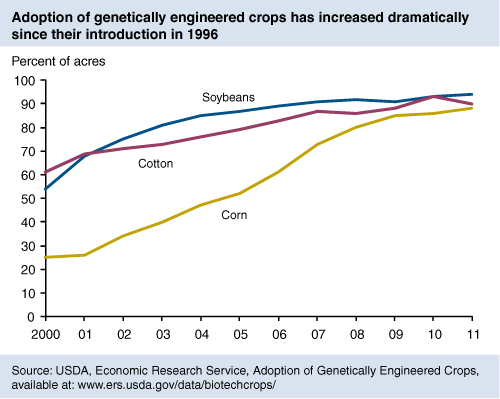
GE crops were introduced in 1996 and have been widely adopted by producers. GE crops include herbicide-tolerant (HT) crops and insect-resistant (Bt) crops. HT crops were developed to survive specific herbicides, particularly glyphosate, that previously would have destroyed the crop along with the targeted weeds. Insect-resistant crops contain the gene from the soil bacterium Bt (Bacillus thuringiensis) that produces a protein toxic to specific insects, protecting the plant from insect damage. Based on USDA survey data, GE crops accounted for 94 percent of U.S. soybean acreage, 90 percent of U.S. cotton acreage, and 88 percent of U.S. corn acreage in 2011.
According to ERS research, U.S. farmers are realizing economic benefits from adopting GE crops, including lower pesticide costs, savings in management time, and, in many cases, higher yields through reduced losses to pests. And to the extent that GE crops lower the cost of production and increase yields, they put downward pressure on crop prices, which, over time, forces out the least efficient producers, encouraging further consolidation of farming resources and concentration of production.
The impacts of GE crops vary with the crop, technology, pest-infestation levels, and other factors. Overall pesticide use and/or pesticide toxicity is lower for adopters of GE crops, and the adoption of herbicide-tolerant crops may also indirectly benefit the environment by encouraging the adoption of less intensive tillage (how farmers prepare their soil for seeding and weed/pest control) practices. However, weed resistance to glyphosate has become a problem in some areas, particularly the South, and some contend that GE crops are not safe to eat (some European countries ban importation of GE commodities). Farmers marketing non-GE varieties also cite potential risks of 'gene flow' from nearby fields planted to GE crops.
Farmers have a number of tillage options, including 'conventional' or plow tillage and several types of 'conservation' tillage—such as mulch till, ridge till, and no-till—that leave at least 30 percent of the soil covered by crop residue. Conservation tillage—particularly no-till—decreases soil erosion, increases water retention, reduces chemical runoff, and can shrink the carbon footprint of agriculture by lowering onfarm energy use and sequestering carbon within the soil.
Adoption of conservation tillage and a corresponding decline in conventional tillage has been stimulated by the prospects of higher economic returns and by public policies and programs promoting reduced tillage for its environmental benefits. As a result, conservation tillage has increased since 1989. Since this tillage option uses fewer resources to ready the land for planting, when coupled with herbicide-tolerant crops, the benefits of GE crops and conservation tillage reinforce each other. However, since conservation tillage does not eliminate pests, when coupled with non-GE crops, pesticide usage and management requirements may increase while potentially lowering crop yields.
Despite the benefits arising from the use of GE crops and conservation tillage, the concentration of production on larger crop farms still generates concerns about food safety, environmental degradation, and the structure of agriculture. This has created a demand for commodities produced using alternative production methods, such as organic farming (see box, "Growth of Organic Foods Markets").
Impacts on Productivity, Commodity Prices, and the Environment
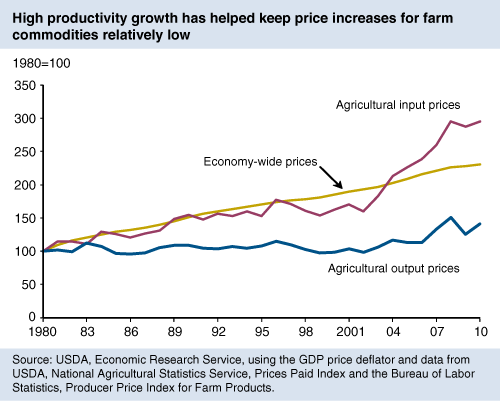
The trend toward concentrated production on specialized operations, while a concern for some, has had economic benefits that should be weighed against potential costs. The changing farming practices discussed here, along with others such as wider use of irrigation and growing adoption of precision agriculture technologies (see "The Information Age and Adoption of Precision Agriculture" in this issue), have allowed the farm sector to increase total output by nearly 50 percent over the past three decades, even as resources used in farming declined. These freed resources have been applied elsewhere, contributing to increased productivity throughout the economy. And consumers of farm products have benefited, too. Despite occasional price spikes and recent trends to the contrary, price increases for agricultural commodities have lagged far behind both economy-wide price increases and increases in prices of agricultural inputs over most of the last 30 years.
The combination of changes in farming practices, conservation program funding, and other structural trends have also resulted in environmental benefits, at least relative to the environmental consequences of producing today's output using the farming practices of the 1970s. Changes in practices like tillage and livestock feed efficiency, when coupled with efforts by farmers to improve nutrient and pest management (often with financial help from and prodding by various levels of government), have helped limit soil erosion and nutrient runoff. As a result, the environmental footprint for the average unit of agricultural output produced has shrunk.
This article is drawn from:
- Farm Structure and Organization. (n.d.). U.S. Department of Agriculture, Economic Research Service.
- Agricultural Productivity in the United States. (n.d.). U.S. Department of Agriculture, Economic Research Service.
- Ahearn, M., Yee, J., Ball, E. & Nehring, R. (1998). Agricultural Productivity in the United States. U.S. Department of Agriculture, Economic Research Service. AIB-740.
You may also like:
- 'Forces Affecting Change in Crop Production Agriculture'. (2010). Choices Magazine. Vol. 25, No. 4: 11-16..


