Guess Who’s Turning 100? Tracking a Century of American Eating
- by Rosanna Mentzer Morrison, Jean C. Buzby and Hodan Farah Wells
- 3/1/2010
Highlights
- USDA’s Economic Research Service maintains the only time-series data on U.S. food availability in the country, a series that now spans 100 years.
- The data play a key role in monitoring the potential for the food supply to meet the nutritional needs of Americans and in examining historical consumption trends.
- A look at 100 years of American eating reveals the technological, political, social, and economic forces affecting food availability.
From meat and potatoes in the early 1900s to deli-prepared rotisserie chicken and Asian pasta salad today, the answer to the age-old question, “What’s for dinner?” has shifted in response to a variety of events—rising wages, nutritional discoveries, wartime rationing, and more women working outside the home, to name a few.
Now in its centennial year, ERS’s food availability data set provides a unique window into how the U.S. food supply responds to political, social, and economic forces, along with ever-evolving technological advancements. By measuring the flow of raw and semi-processed commodities through the U.S. marketing system, ERS’s food availability data reveal the types and amounts of food commodities available for consumption.
This one-of-a-kind data set measures which food commodities are available to eat at the national level and provides the foundation for estimating if the nutrients available support a healthy, well-nourished citizenry. The data date back to 1909, allowing researchers, marketers, and policymakers to examine historical consumption trends and shifts in food demand. These trends are important for assessing the health of Americans and forecasting the direction eating patterns are headed.
Data Series Has Roots in World War II Readiness Efforts
ERS’s food availability data series has evolved from a check on America’s readiness for World War II to a major component of the Nation’s nutrition monitoring system. In 1941, USDA published the first comprehensive data system to assess the availability of 18 food commodities. By 1949, information on food availability back to 1909 had been compiled and added to the data series. By 1961, USDA was measuring the per capita availability of 53 commodities, including supplies of fish and seafood, home-canned fruit and vegetables, and game meat. Today, the data cover several hundred commodities, though game meats and home-produced food are no longer counted.
ERS annually calculates the available supply of each commodity as the sum of production, beginning inventories, and imports and then subtracts exports; farm, industrial, and other nonfood uses; and end-of-year inventories to derive an estimate of the amount of food available for consumption. Food availability includes all food—from grocery stores, restaurants, school cafeterias, and other eating places. Per capita estimates are calculated each year by dividing the total availability of a commodity by the U.S. population. These national estimates cannot be broken into State or regional estimates or intodemographic groups.
The data are collected from producers and distributors or are estimated by Government agencies using sampling and statistical methods. The data are not collected from individual consumers, so they are independent of deliberate or accidental overreporting or underreporting by survey respondents.
Food availability is a supply measure, not an intake measure. The availability data typically overstate actual consumption because they do not account for spoilage and waste in the marketing system and at home. Therefore, ERS’s food availability data indicate trends in consumption over time rather than absolute levels of food eaten.
Availability Data Reveal Evolving Food Choices
Although it is difficult to predict what economic, food safety, health, or other issues Americans will face, ERS’s food availability data help researchers answer critical questions about U.S. food consumption trends, such as: How do new technologies and new products, health fads and scares, and changing social norms shape food choices? What effects do agricultural policies have on commodity production and prices and, in turn, food supplies? Or, what will be the health outcomes of rising (or falling) incomes and increasing employment of women?
A century of ERS’s food availability data reveals how the sometimes conflicting, sometimes reinforcing technological, political, social, and economic forces affect the types and amounts of commodities available for consumption. The following examples illustrate some of these forces and their impacts.
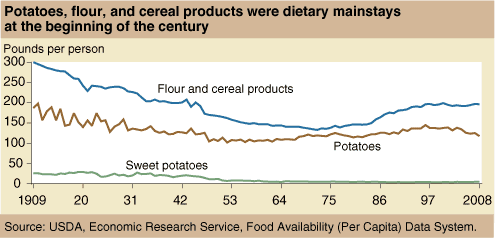
Rising Incomes and Trade—During the first half of the 1900s, the most significant changes among food crops were the substantial declines in availability of potatoes, sweet potatoes, and flour and cereal products. Availability of potatoes and sweet potatoes fell from 213.2 pounds per person in 1909 to 114.4 pounds in 1959, while availability of flour and cereal products dropped from 300 to 147 pounds per person. An improved ratio of wages to food prices allowed many to diversify their food spending beyond flour, potatoes, and meats. Greater purchasing power, coupled with increased availability of fresh fruit and vegetables over the winter and growing vitamin consciousness, led Americans to spend a larger portion of their food budgets on milk, cheese, fruit, and vegetables.
In the second half of the century, Americans enjoyed ever-more varied, year-round, fresh produce options, thanks to a growing global food market. Kiwi fruit from New Zealand, grapes from Chile, brie cheese from France, and shrimp from Thailand are now grocery store staples.
Flour and cereal product availability grew as well. Between 1972 and 2008, per capita availability of flour and cereal products increased from a record low 133 pounds per person to 196.5 pounds. The expansion reflects ample cereal stocks, strong consumer demand for a variety of breads, growing popularity of grain-based snack foods and other bakery items, and increased eating out that includes products served with buns, dough, and tortillas.
Health Information—Milk availability from 1909 to 2008 dramatically demonstrates the impact of health information on food choices. In 1918, Elmer McCollum, a leading nutritionist at Yale University, labeled milk a “protective” food. McCollum regarded milk, fruit, and vegetables—foods that contained newly discovered substances called vitamins—as critical for preventing specific diseases and promoting healthy growth.
A wildly popular pamphlet published that same year by the U.S. Children’s Bureau entitled Milk, the Indispensable Food for Children required a second rush printing to meet the demand from mothers for information on milk’s importance. Milk availability grew from a yearly average of 31.3 gallons per person in the 1910s to 39.2 gallons in the 1940s. Similarly, the shift from whole to lower fat milk over the past 30 years owes much to the nutritional advice to “choose lower fat foods.”
In 1946, President Harry Truman signed the National School Lunch Act, establishing USDA’s National School Lunch Program. This and subsequent school feeding programs (School Breakfast, Special Milk, and Summer Food Service) included milk in their meals, propping up demand for milk, at least by schools. However, competition from soft drinks, fruit juices, and, more recently, bottled water, has contributed to the decline in milk availability over the second half of the 20th century and into the first decade of the 21st century. Milk availability is down from its peak of 44.7 gallons per person in 1945 to 20.8 gallons in 2008.
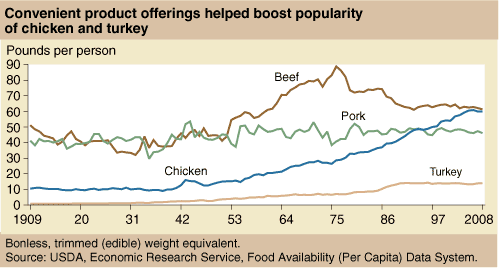
New Technologies—Chicken availability over the past 100 years illustrates the effects of new technologies and product development. Increased chicken availability from 10.4 pounds per person in 1909 to 58.8 pounds in 2008 reflects the industry’s development of lower cost, meaty broilers in the 1940s and later, ready-to cook products, such as boneless breasts and chicken nuggets, as well as ready-to-eat products, such as pre-cooked chicken strips to toss in salads or pasta dishes.
Broilers were first marketed in the 1920s as a specialty item for restaurants. By the mid-1950s, innovations in breeding, mass production, and processing had made chicken more plentiful, affordable, and convenient for the dining-out market and for cooking at home. Media coverage of health concerns associated with total fat, saturated fat, and cholesterol in the last quarter of the 1900s may have contributed to a rise in chicken tacos andturkey burgers.
Agricultural Policies—Over the past 100 years, agricultural policies have contributed to changes in the availability of different commodities. For example, Americans have always had a sweet tooth, but how that craving is satisfied has changed. The sweeteners category in the availability data include use of sugar and syrups at home, as well as in processed foods and beverages. Sweetener availability stood at 83.4 pounds per person of sugar, molasses, honey, corn syrup, and other syrups in 1909. In the first half of the 20th century, molasses was one of the “three M’s” in Southern sharecroppers’ core diet—meat (salt pork), molasses, and meal (cornmeal).
Between 1924 and 1974, availability of sweeteners averaged 113.2 pounds per capita, not including the sugar-rationing World War II years. A variety of Government policies—investments in public research that raised yields for corn, sugar production allotments and trade restrictions, and subsidies for corn production—helped make corn sweeteners relatively less expensive than sugar. Food manufacturers responded by using the cheaper corn sweeteners, especially high fructose corn syrup (HFCS), in place of sugar in an ever-expanding array of processed products ranging from soft drinks and breakfast cereals to soups and spaghetti sauce. In 2008, HFCS accounted for 39 percent of the 136.3 pounds per person of sweeteners available for consumption.
Changing Social Norms—Social forces also play a role in shifts in food availability. Cooking or supervising the cooking was once regarded as one of a wife’s primary household tasks. The 1920s, however, saw a shift toward middle-class husbands and wives as “a couple” who participated jointly in leisure activities—movies, bridge parties, and automobile rides. Less time for cooking led to greater reliance on processed foods and eating out.
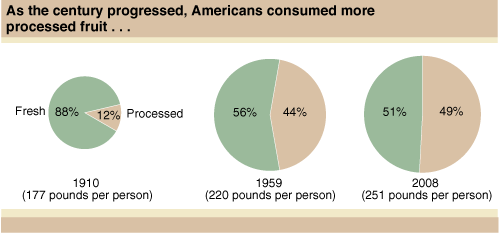
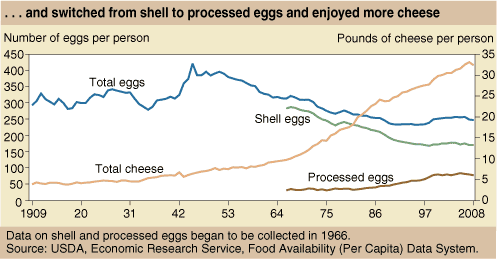
Food preparation time became even scarcer and demand for convenience grew as women entered the labor force in greater numbers. In 1910, 25 percent of women were in the workforce; by 1960, 35 percent of women were working outside the home. The decline in availability of shell eggs and rising availability of processed eggs reflected less time for preparing breakfast and baking cakes and increased purchasing of more food products containing processed eggs. Similarly, the increased share of canned, frozen, and other processed fruit in 1959 versus 1910 reflected growing demand for convenience.
Increasing availability of fats and oils and cheese reflects their use in processed foods and the growing eating-out market in the second half of the century. The availability of fats and oils grew from 36 pounds per person in 1909 to 87 pounds in 2008. Much of this increase was in salad and cooking oils used to cook french fries, a mainstay of fast food and other restaurant menus. Cheese availability also skyrocketed—growing from 11.4 pounds per person in 1970 to 31.4 pounds in 2008. Cheese owes much of its growth to the spread of Italian and Mexican eateries in the United States and to innovative, convenient packaging, such as string cheese for lunch boxes.
Data System Adds Second Series To Measure Food Loss
The ERS food availability data overstate the amount of food actually ingested because the data do not take into account quantities of food lost through waste, moisture loss, and spoilage in the marketing system and the home. Therefore, in the mid-1990s, ERS began developing a second data series—loss-adjusted food availability—that adjusts for spoilage and other losses. This second series accounts for three general types of food loss:
- from farm to retail;
- at the retail level (for example, in supermarkets, supercenters, mom-and-pop grocery stores, and other retail outlets);
- and at the consumer level, which includes losses for food consumed at home and in restaurants and other foodservice outlets. This loss has two components—first, the nonedible portion of a food, such as asparagus stalks and apple cores, as estimated by USDA’s Agricultural Research Service and second, cooking loss and uneaten food, such as plate waste.
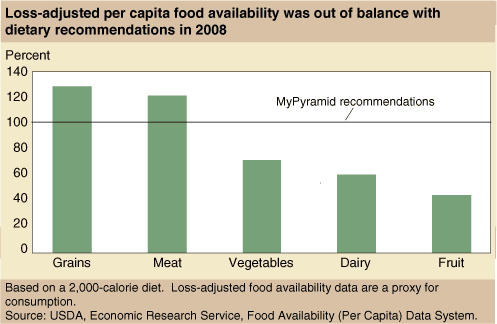
Losses vary by commodity. For example, loss at all three levels for fresh apples is estimated at 39 percent, versus 18 percent for cheddar cheese. ERS converts the loss-adjusted data into both daily per capita calories and food servings. Adjusting for spoilage and other losses reduces the estimated number of calories available in 2005 from 4,000 per person per day to 2,705, up from 2,172 in 1970. Supersizing of food portions by food processors, eating places, and cookbook authors accounts in part for the increasing amount of loss-adjusted available calories since 1970. Comparing servings to Federal dietary recommendations shows that Americans eat too many servings from the grains and meat, eggs, and nut groups, and too few servings of vegetables, dairy products, and fruit, assuming a 2,000-calorie diet.
To help researchers, marketers, and policymakers analyze the next century of American eating, ERS has updated and enhanced the usability of its food availability data system. The system has been expanded to include a multimedia product, which combines an introductory video, slides and audio commentary, and access to interactive data. A table compares the recommended use, commodity coverage, and special characteristics for the different data series, and revised Website pages contain new documentation, a more comprehensive glossary, and an expanded question-and-answer section. ERS has developed a “Custom Reports” feature for both the food availability data and the loss-adjusted data. Through these custom reports, users can make tailored tables and charts, download data, and save and print images.
ERS researchers are also engaged in a multiyear effort to update and document the food loss assumptions underlying the loss-adjusted food availability data. Using inventory and sales data from half a dozen large national and regional supermarket chains, ERS has revised the retail loss estimates for fresh fruit, vegetables, meat, poultry, and seafood. ERS has other initiatives under way to update loss estimates at the farm-to-retail level and at the consumer level, providing a more accurate picture of what Americans are eating.
This article is drawn from:
- Food Availability (Per Capita) Data System. (n.d.). U.S. Department of Agriculture, Economic Research Service.
You may also like:
- Wells, H.F. & Buzby, J.C. (2008). Dietary Assessment of Major Trends in U.S. Food Consumption, 1970-2005. U.S. Department of Agriculture, Economic Research Service. EIB-33.
- Buzby, J.C., Wells, H.F., Axtman, B. & Mickey, J. (2009). Supermarket Loss Estimates for Fresh Fruit, Vegetables, Meat, Poultry, and Seafood and Their Use in the ERS Loss-Adjusted Food Availability Data. U.S. Department of Agriculture, Economic Research Service. EIB-44.
- Eating in the 20th Century. (2000). Economic Research Service. in Food Review..


