Trade Data Show Value, Variety, and Sources of U.S. Food Imports
- by Nora Brooks, Anita Regmi and Jean C. Buzby
- 9/1/2009
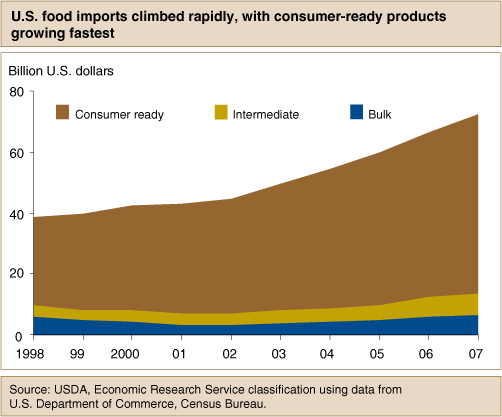
U.S. food and agricultural product imports have been rising for decades. In fact, they increased from $41 billion in 1998 to $78 billion in 2007 in response to the combined effects of trade liberalization, changes in food supply chains, and increased consumer preferences for a wide variety of foods. Imports of fish and shellfish, many fresh fruit and vegetables, fruit juices, tree nuts, and salad and cooking oils account for large shares of domestic consumption. Many agricultural imports with a large share of domestic consumption are products the United States does not produce in large quantities, such as bananas or coffee. U.S. trade data are collected by the U.S. Department of Homeland Security, U.S. Customs and Border Protection and compiled and distributed monthly by the U.S. Department of Commerce’s Census Bureau using the United States’ Harmonized Tariff Schedule (HTS) of 10-digit codes. Congress mandated that USDA define which of these codes constitute agriculture and provide the public with statistics on U.S. agricultural trade. To fulfill this responsibility, USDA has maintained the Foreign Agricultural Trade of the United States (FATUS) database since about 1926. FATUS provides data on the volume and value of U.S. agricultural exports and imports, by major countries and commodities. Data are updated online monthly from 1989 to the present.
Consumer-Ready Product Imports Showed Largest Gain
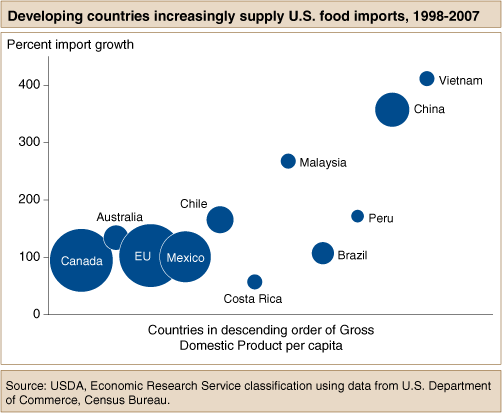
In the past decade, U.S. imports came primarily from Canada, Mexico, the European Union, Australia, Brazil, and China. The top import sources have changed little since 1990, but the number of countries exporting food and agricultural products to the U.S. has greatly increased, and the import share of developing countries has been rising steadily since 2001.
Rapid U.S. import growth in 2002-07 was driven primarily by increased imports of consumer-ready products, such as fresh fruit, vegetables, meats, seafood, and processed foods. Import growth was relatively stable for raw bulk food commodities, such as grains and oilseeds, and semi-processed intermediate products, such as oils, sweeteners, and cocoa paste. Horticultural products, including fruit, vegetables, nuts, wine, malt beverages, and nursery products, have accounted for nearly half of all U.S. agricultural imports since 2002. Sugar and tropical-product imports have exceeded livestock and livestock product imports since 2005.
Developing Countries Were a Growing Source of U.S. Imports
While developed countries such as Canada and the European Union were among the top sources of U.S. food imports, the greatest growth between 1998 and 2007 was among imports from the developing countries. Seasonal and climatic factors contributed to an influx of fresh fruit and vegetables and other tropical products from many developing countries. U.S. imports of processed food products from these countries also increased in response to globalization of the food industry and in-flow of foreign direct investments that expanded food processing capabilities in many developing countries.
U.S. imports of fresh fruit, vegetables, and other horticultural products from Central and South American countries increased significantly. For example, U.S. imports of fresh fruit and vegetables from Chile grew from about $800 million in 1998 to $2.5 billion in 2007. Similarly, imports of dried, frozen, and processed fruit and vegetables, fish, and spices were increasingly sourced from China, Vietnam, and other Asian countries. Malaysia was a major source of tropical oils and the biggest supplier of cocoa butter and paste.
More Variety, More Countries
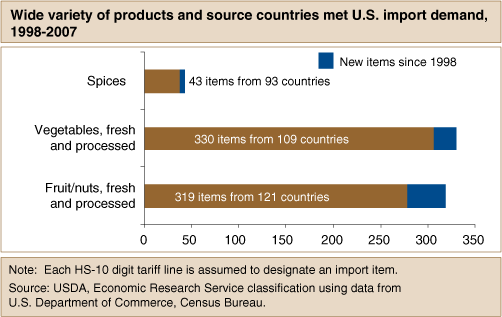
As the number of different products imported into the United States grew over the years, so, too, did the number of source countries. In 2007, for example, 319 different fruit products were imported from 121 different countries, including 41 new products and 10 new source countries since 1998.
New products imported into the United States included a variety of fresh and processed fruit and vegetables, including such exotic tropical varieties of fruit as durian, lychee, and guava, and a myriad of other fresh and processed fruit, vegetables, and spices.
The growth in the number of imported products coincided with the number of countries exporting a particular type of food product into the U.S. In 2007, the United States imported artichokes from China and Ecuador, certain types of processed bamboo shoots from Colombia and China, garbanzo beans from Trinidad and India, pepper products from Kyrgyzstan, cinnamon from Ethiopia, and nutmeg from Gabon—none of these countries were listed as sources for such products in 1998.
U.S. Perishable Food Imports Mostly Sourced From Neighboring Countries
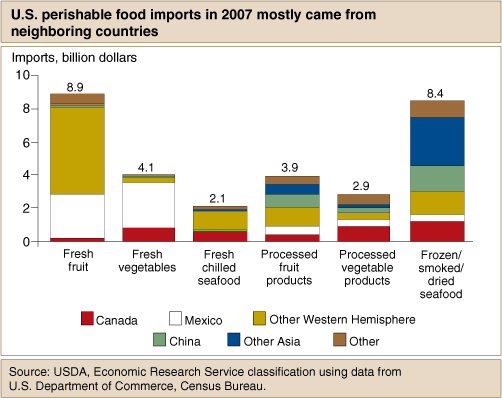
Most U.S. fresh produce and seafood imports are sourced from nearby countries in the Western Hemisphere, while processed fruit, vegetables, and seafood may come from more distant countries. Among other factors, seasonal availability, the North American Free Trade Agreement with Mexico and Canada, and consideration of the speed and cost of transportation may have contributed to this import pattern.
This article is drawn from:
- Brooks, N., Regmi, A. & Jerardo, A. (2009). U.S. Food Import Patterns, 1998-2007. U.S. Department of Agriculture, Economic Research Service. FAU-125.
- Globalization and Evolving Preferences Drive U.S. Food Import Growth. (2009). Journal of Food Distribution Research, Vol. 40, No. 1.
You may also like:
- U.S. Agricultural Trade. (n.d.). U.S. Department of Agriculture, Economic Research Service.
- U.S. Food Imports. (n.d.). U.S. Department of Agriculture, Economic Research Service.


