Productivity Growth Drives Expanded Agricultural Production
- by Kathleen Kassel, James M. MacDonald and Sun Ling Wang
- 9/1/2008
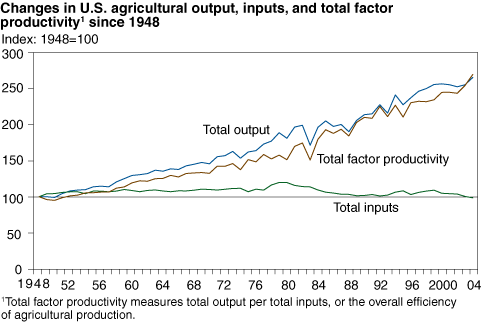
U.S. agriculture relies almost entirely on productivity growth, primarily from innovation and changes in technology, to raise output. Total production nearly tripled between 1948 and 2004, while land in agriculture fell by one-quarter and labor declined by three-quarters. Because of high productivity growth, agricultural commodity prices rose at less than half the rate of economy-wide prices over those 56 years.
What Is Productivity?
Simple measures of productivity growth, such as increases in output per acre (yields) or output per worker (labor productivity) have been used for many years. These are called single-factor measures because they relate changes in output to changes in a single input, such as land or labor. Single factor measures, while useful, take no account of the usage of other inputs. Land yields could be raised, for example, by adding more capital or chemicals. But that would not provide true productivity improvements if the value of the added inputs exceeded that of the land that they replaced.
ERS’s productivity indexes allow researchers to identify the separate roles of changes in input use and productivity-improving developments in technology in driving growth in U.S. agricultural output. Increased total factor productivity (TFP) is the difference between the growth in agricultural output and growth in inputs. ERS publishes TFP measures for the U.S. farm sector for 1948 to 2004 and for individual States from 1960 to 2004.
| Source | 1948-2004 | 1948-53 | 1953-57 | 1957-60 | 1960-66 | 1966-69 | 1969-73 | 1973-79 | 1979-89 | 1989-99 | 1999-2004 |
|---|---|---|---|---|---|---|---|---|---|---|---|
| Labor | -0.56 | -0.86 | -1.14 | -0.89 | -0.86 | -0.65 | -0.42 | -0.22 | -0.35 | -0.24 | -0.78 |
| Capital (inc. land) | -0.08 | 0.61 | 0.01 | -0.06 | 0.06 | 0.14 | -0.12 | 0.39 | -0.67 | -0.28 | -0.11 |
| Materials | 0.61 | 1.56 | 1.16 | 1.45 | 0.74 | 1.23 | 0.76 | 1.01 | -0.66 | 1.24 | -1.15 |
| Total factor productivity | 1.77 | 0.45 | 1.00 | 3.80 | 1.11 | 1.56 | 2.24 | 1.28 | 2.53 | 1.44 | 2.79 |
| Total output growth | 1.74 | 1.76 | 1.03 | 4.31 | 1.04 | 2.28 | 2.46 | 2.46 | 0.86 | 2.17 | 0.75 |
| The sub-periods are measured from cyclical peak to peak. Source: USDA, Economic Research Service. |
|||||||||||
ERS Estimates Show Less Land, Labor, but Greater Productivity
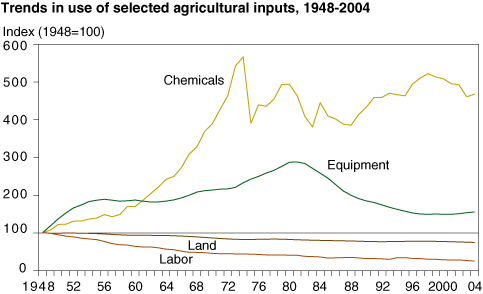
The TFP indexes reveal the dramatic contraction of labor in the farm sector. Agricultural land, a component of capital, also fell steadily, except for a brief cessation in the 1970s, and by 2004 amounted to less than three-quarters of its 1948 value. In contrast, the sector’s use of equipment and of material inputs—energy, fertilizers, pesticides, and purchased services—increased considerably until the early 1980s. After that, materials inputs fluctuated but showed no strong growth, and equipment inputs declined.
Between 1948 and 1979, the sector substituted expanded usage of equipment and agricultural chemicals for declining land and labor inputs. As a result, materials accounted for a significant share of agricultural output growth, even though growth in total factor productivity was also important. However, output continued to grow after 1979, while capital inputs declined and material inputs (including chemicals) grew very little, compared with levels in 1979. Consequently, growth in TFP accounted for all of the post-1979 expansion of output.
There can be little doubt that productivity growth has been the engine of economic growth in post World War II agriculture. TFP growth sparked most of the gains in production between 1948 and 1979, with added capital and materials accounting for the remainder. After 1979, when inputs in total declined, TFP drove all of the substantial increase in aggregate agricultural production.
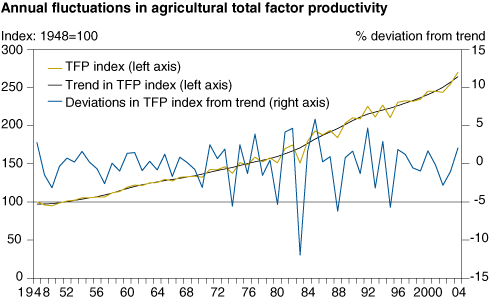
While the trend rate of TFP growth is large, the measures also show sharp year-to-year deviations from that trend, and TFP can even decline in some years as a result of weather and economic events. Measured TFP growth fell in 1974 and 1978 when energy prices spiked, and sharp downturns occurred during drought years in 1983, 1988, and 1995. Poor weather hindered production and left TFP flat between 2000 and 2002. But the return of favorable weather in 2003 and 2004 led to sharp increases in output and productivity, with TFP growing by 4.4 percent in 2003 and 6.0 percent in 2004.
Longrun TFP growth is driven by the development and diffusion of innovations in plant and animal breeding, capital and materials, production practices, and agricultural organization. Economic researchers have found a strong link between investments in research and innovation and agricultural productivity growth.
This article is drawn from:
- Agricultural Productivity in the United States. (n.d.). U.S. Department of Agriculture, Economic Research Service.


