The Creative Class: A Key to Rural Growth
- by David McGranahan and Tim Wojan
- 4/1/2007
Highlights
- The creative-class thesis—that towns need to attract engineers, architects, artists, and people in other creative occupations to compete in today’s economy—may be particularly relevant to rural communities, which tend to lose much of their talent when young adults leave for college, the Armed Forces, or “city lights.”
- The creative class lives mostly in urban settings, but is also found in rural areas with mountains, lakes, and other rural amenities.
- Nonmetro counties with higher proportions of people in creative class occupations tended to have higher rates of patent formation and manufacturing technology adoption in the 1990s— and higher rates of job growth in 1990-2004.
The names are familiar—California’s Silicon Valley, North Carolina’s Research Triangle, and Boston’s high-tech Route 128 Corridor. Over the past several decades, research has shown how university research facilities, high-tech firms, and other creative endeavors have sparked significant growth in these and other urban economies. While high-tech firms and major research and development (R&D) activities are not typically located in rural areas, talent and creativity are needed throughout the U.S. economy—in the creation of new types of products and in the adoption of new production and information technologies and new marketing strategies.
ERS researchers explored the importance of the “creative class”—people in highly creative occupations such as business ownership and top management, science, engineering, architecture, design, arts, and entertainment—for rural growth in the 1990s (see box, “How Is the Creative Class Measured?”). They found that the creative class was present in rural areas, particularly in high-amenity areas, and that its presence was associated with measures of creativity, such as patent awards and technology adoption, and with growth in jobs during 1990-2004. Many rural analysts have declared that the era of smokestack chasing is over; the creative-class analysis suggests that chasing talent is a viable alternative for sparking local growth.
The Creative Class Theory
Many economists and geographers point to high-tech firms, research and development (R&D) activity, and patents as sources of new economic growth, but regional scientist Richard Florida focuses on people, arguing that the knowledge and ideas requisite for economic growth are embodied in occupations involving high levels of creativity. These occupations constitute the “creative class,” the ultimate source of economic dynamism in today’s “knowledge economy.”
The geographic mobility of the creative class is central to Florida’s thesis. He argues that people in these occupations tend to seek a high quality of life as well as rewarding work, and they are drawn to cities with cultural diversity, active street scenes, and outdoor recreation opportunities. Good local universities alone will not lead to local economic dynamism as graduates may move to more attractive places upon obtaining their degrees. In this context, the key to local growth is to attract and retain talent, as talent leads to further job creation.
While developed with major metropolitan areas in mind, the creative-class thesis seems particularly relevant to rural areas, which lose much of their young talent as high school graduates leave, usually for highly urban environments. These rural areas, especially, need to attract talented young families, midlife career changers, active retirees, and others to maintain their talent base and thereby their economies. Given that rural earnings tend to be lower than urban earnings, especially for those with a college degree, rural quality of life would seem an essential part of that attraction.
Where Is the Creative Class?
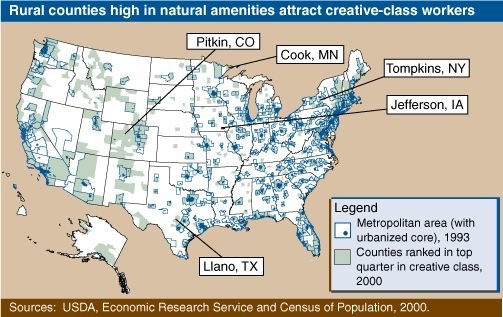
The creative class is predominately urban. In both 1990 and 2000, two-thirds of the “creative-class counties,” those ranking in the top quarter in the proportion or residents employed in creative-class occupations, were metropolitan even though nonmetropolitan counties are twice as numerous. Metropolitan creative-class counties are found across the country, but especially in the major urban areas.
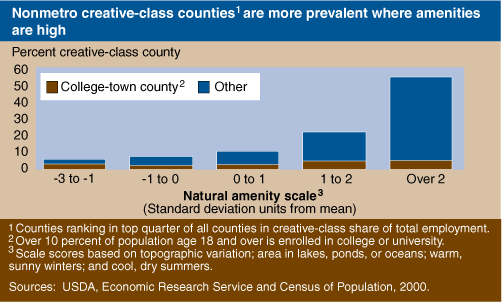
In 2000 (as in 1990), about 260 or 11 percent of nonmetro counties ranked as creative-class counties. Regional differences are more pronounced than with metro creative-class counties; New England and the mountain areas of the West have higher shares of rural creative-class-counties than the Midwest and South. Consistent with the thesis that quality-of-life considerations strongly motivate the creative class, counties high in natural amenities are most likely to be creative-class magnets. Pitkin County, Colorado (which contains Aspen), for example, had the largest creative-class proportion of all nonmetro counties in both 1990 and 2000.
Counties dominated by colleges and universities also ranked high in creative-class proportions. Tompkins County, New York, for example, has Cornell University. Jefferson County, Iowa, a Midwestern creative-class magnet, is home to Maharishi International University. As a draw for Transcendental Meditation adherents, the county has attracted many urban professionals who have started or work for more than 100 software development and professional service firms located there. Most of the nonmetro creative-class counties in low natural-amenity areas have colleges or universities.
Mountain landscapes and universities are not required to attract the creative class to rural areas. Llano County does not contain a large college or university but is in the Texas Hill Country near Austin and borders on two large lakes. Robust growth in the number of artists in the county during the 1990s is representative of “artistic havens” emerging in select rural counties. Cook County, Minnesota, is a hiking and canoeing area, but it also has the oldest active artist colony in Minnesota. With a playhouse and a music association, it is where “culture merges with woods and water” (Grand Marais Chamber of Commerce).
Do Areas With More Creative Class Show More Creativity?
A critical link in the creative-class argument is that places with a higher concentration of creative occupations actually have more creative activities. One often-used measure of local creativity is the ratio of patents to employment or population. The 1990s patent rate (number of patents in 1990-99 per 1,000 employed in 1990) was, on average, much higher in metro (4.9) than nonmetro counties (1.7)—not surprising given the urban location of research universities and R&D activities. However, within nonmetro areas, the average patent rate was twice as high in creative-class counties (3.3) as in other counties (1.5). Creative-class counties tended to generate more patents whether or not universities were present. Thus, while the aforementioned Tompkins and Jefferson Counties were in the top quarter of all counties ranked by patent rate, so were Llano and Pitkin Counties (although not Cook County).
The adoption of new technologies and ideas is a natural spinoff of knowledge and creativity. Rural economies have few firms making high-tech products, but the incorporation of these products in production and communications is important for competitiveness. While no economy-wide indicators of adoption are available, the 1996 ERS Manufacturing Survey measured the adoption of advanced production and information technologies and new management practices. A scale of 16 adoption items—ranging from computer-assisted design to satellite communications to self-directed work teams—indicates advanced technology use. Those establishments using nine or more practices were considered “high adopters.” Branch plants aside (their technology use is likely to be influenced by their headquarters), establishments in nonmetro creative-class counties were more likely to be high adopters (20 percent) than establishments in other nonmetro locations (15 percent). Creative-class presence also made a difference in metro counties.
Counties with high proportions of creative-class residents appear to have more creative activity with regard to patents and technology adoption. It is not clear, however, if this simply reflects self-selection (that is, people who invent and/or adopt new technologies and practices may tend to locate in high-amenity, creative-class settings) or if high creative-class environments engender more patenting and technology adoption.
Is the Rural Creative Class Associated With Local Growth?
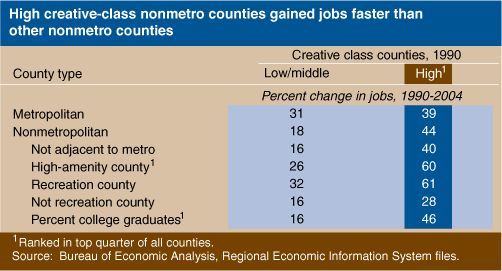
The creative class was highly associated with growth in rural areas in 1990-2004. Other nonmetro counties grew relatively slowly in the 1990s, but creative-class nonmetro counties tended to gain jobs over the period at a faster rate than their metro counterparts.
While rural creative-class counties may grow because of the presence of the creative class, it is possible that the amenities that attracted the creative class were responsible for the higher job growth in creative-class counties in the 1990s. However, whether considering high-amenity, recreation, high-education, or other attributes, counties with a high proportion of creative-class residents generally had job growth rates that were twice as high as counties with less creative class presence.
A larger ERS analysis, which included 2,145 nonmetro counties in the 48 contiguous States, took into account a number of other possible influences on the location of the creative class and its relationship with rural growth during the 1990s. The analysis included measures of landscape and climate, settlement density and commuting, industry structure (farming, mining, manufacturing, business services, and recreation), racial/ethnic composition, labor market characteristics, age structure, and—to capture regional influences—aggregate job growth in the surrounding counties. This analysis found that both the level and change in the creative class were linked directly to job growth.
The presence of the creative class may itself create amenities. For instance, a place that has attracted artists and designers may appeal to people who like artistic communities. And, the influence may be indirect—people may be drawn to a community by the restaurants, stores, and other consumer services that develop in response to the consumption patterns of the creative class. However, ERS analysis showed that both the 1990 creative-class proportion and the 1990-2000 creative-class growth were more highly related to job growth than population increases during the 1990s, suggesting that the central influence of the creative class is a more effective use of local resources and opportunities and hence greater growth in jobs, which facilitates population growth.
The creative-class analysis suggests that rural growth depends greatly on the attractiveness of rural communities, their landscapes, and their climates. Visits to websites of chambers of commerce and local development organizations in rural areas show that many rural communities are advertising their quality-of-life amenities to prospective businesses and residents. However, economic evaluations of the impact of public and private investments on growth still rarely consider quality-of-life factors. The creative-class study suggests rural growth impacts cannot be understood without taking these factors into consideration.
Despite an urban affinity, the creative class—perhaps more able and apt than others in the workforce to choose where to live based on quality-of-life considerations—can be drawn out of cities to high-amenity rural locations. Their activities, in turn, appear to generate new jobs and local growth. Rural areas lack the business and consumer services available to urban businesses and residents, but rural areas tend to have the upper hand in landscape, which may service the creative temperament.
This article is drawn from:
- Creative Class County Codes. (n.d.). U.S. Department of Agriculture, Economic Research Service.
- Recasting the Creative Class To Examine Growth Processes in Rural and Urban Counties. (2007). Regional Studies. 41(2007): 41:2..
- Ambient Returns: Creative Capital’s Contribution to Local Manufacturing Competitiveness. (2007). Agricultural and Resource Economics Review. 36:1..
You may also like:
- The Emergence of Rural Artistic Havens: A First Look. (2007). Agricultural and Resource Economics Review. 36:1..
- Understanding Rural Population Loss. (2003). Economic Research Service. in Rural America, Vol. 17, Issue 4..


