Behind the Data
- by David McGranahan
- 4/1/2005
Natural Amenities Scale
Nature is rural America's greatest resource. At one time, its primary use was for food, timber, and minerals. But the enjoyment by vacationers, young families, and retirees is now its major use in many areas. Forest Service surveys show that over half of the U.S. population age 16 and older spends time outdoors viewing natural scenery in any given year.
Just as not all land is equally good for farming, not all nature is equally attractive to visit or inhabit. While researchers have developed several measures of the suitability of land for farming, they are only beginning to develop similar measures of the relative attractiveness of different outdoor settings.
ERS created a very basic scale of natural amenities, including climate, topography, and water (lakes, ponds, oceans)—all relatively enduring characteristics. The scale includes four measures of climate: average number of days of sun in January, average January temperature, lowness of average July humidity, and temperateness of July weather. Temperateness is measured in such a way that places with the warmest winters and coolest summers score highest on the scale.
The topography measure was taken from a 1937 National Geographic map, which had 26 categories ranging from flat with no hills to highly mountainous. The water measure is based on the proportion of county area classified as water by the Bureau of the Census. Because county boundaries extend offshore, ocean front as well as lakes and ponds are reflected in this measure. The measure used in the scale is a relative (logarithmic) measure. (For example, if County B has twice as much water area per square mile as County A, the difference in scores is the same whether County A is 5 percent water or 25 percent water.)
These six characteristics do not tend to be found together; often there are tradeoffs. For instance, areas with more extensive surface water tend to have more temperate climates than their neighbors, but they also tend to have cloudier Januarys and more humid Julys. The natural amenities scale is designed to reflect these tradeoffs by combining these characteristics into a single scale. Statistical analyses of county population data from 1970 to 1996 indicate that the scale accurately reflects the overall relationships between these characteristics and population change during that period. These analyses and the methods used to create the scale are described in an ERS report, Natural Amenities Drive Rural Population Change (AER-781).
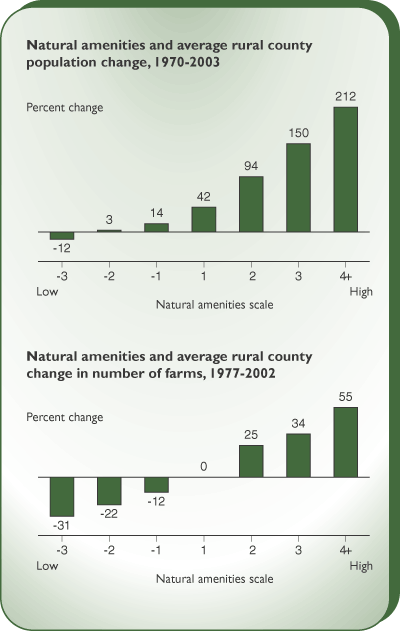
The scale highlights the association between natural amenities and population change over the past 30 years. Counties at the high end more than tripled their population on average over the past 32 years, while counties at the low end lost population. However, the scale is useful in other ways as well. For instance, while the number of farms in the U.S. has declined dramatically over time, the number has actually risen in high-amenity counties. There are a number of possible reasons for this. For instance, counties with low scores tend to be relatively flat and extensively farmed, making farm consolidation relatively easy. At the same time, given that people are drawn to natural amenities, it is possible that there are far more prospective farmers—even among sons and daughters—in places where landscape is varied, climate is pleasant, and population and employment are growing.
This article is drawn from:
- McGranahan, D. (1999). Natural Amenities Drive Rural Population Change. U.S. Department of Agriculture, Economic Research Service. AER-781.


