Data Feature
- by C.S. Kim and William Quinby
- 6/1/2004
ARMS Data Offer New Perspectives on Cropping Practices
The Agricultural Resource Management Survey (ARMS) is USDA's primary vehicle for collecting information on agricultural resource use, production practices, farm costs and returns, farm financial conditions, and the economic well-being of America's farm households. Sponsored jointly by ERS and USDA's National Agricultural Statistics Service (NASS), ARMS was initiated in 1996 as an effort to consolidate and integrate the former USDA cropping practice, chemical use, and farm costs and returns surveys (which date back several decades). ARMS data support ERS's research and analyses to inform USDA, administration, congressional, and industry decisionmakers when weighing alternative policies and programs that involve the farm sector or affect farm families.
ARMS data also underpin USDA's annual estimates of net farm income, subsequently provided to the Bureau of Economic Analysis for developing annual estimates of gross domestic product and personal income. The ARMS survey fulfills a congressional mandate that USDA provide annual cost-of-production estimates for commodities covered under farm price support legislation. ARMS also provides data regarding chemical use on field crops as required under environmental and food safety legislation. Key technology adoption decisions tracked by ARMS include the choice of bioengineered seed, the selection of waste management practices by livestock producers, the use of chemical and biological pest management alternatives, and the use of information management technologies—ranging from precision farming in crop production to marketing commodities and buying inputs via the Internet.
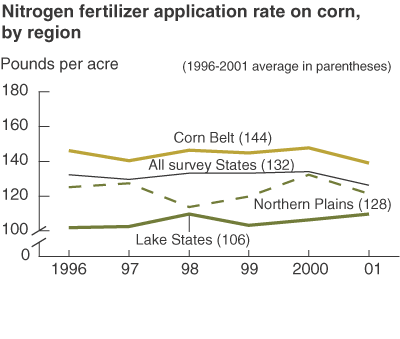
Complementing the breadth of ARMS data is their potential use for conducting detailed analyses. To illustrate, let's look at a small part of the data related to commercial nitrogen (N) fertilizer application rates (N-application rates) on corn. Nitrogen is an essential input to high-yield corn production. However, nitrogen contained in runoff from farm fields can contribute to degradation of water quality in U.S. rivers and estuaries. Keeping tabs on nitrogen fertilizer application rates can help farmers and policymakers face the challenge of protecting water quality without compromising corn yields.
Corn yields are influenced by a variety of factors: agronomic (for example, soil productivity), climatic (for example, adequate and timely rainfall), and cropping practices (for example, nutrient application). N-application rates in the Corn Belt are much higher on average than in other major corn regions because agronomic and climatic conditions there are generally more favorable for attaining higher corn yields. N-application rates in the Northern Plains tend to be lower than in the Corn Belt due to climatic constraints on yields. Contributing to lower commercial nitrogen application rates in the Lake States is the more widespread availability of supplemental nitrogen from manure associated with livestock production in that region.
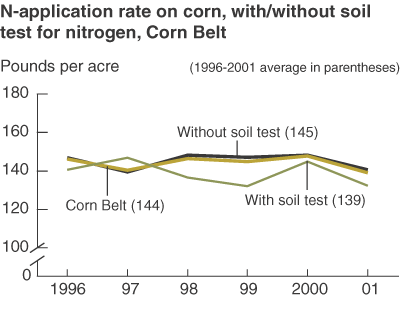
N-application rates also appear to vary as a result of prior information about existing soil nitrogen levels, obtained from soil tests and other means. In the Corn Belt, for example, about 17 percent of corn acres were tested for soil nitrogen during 1996-2001. Farmers applied about 6 pounds of N per acre (4 percent) less on those acres than the average for corn acres not tested. This reinforces one of the purposes of ARMS: better information can help improve farmers' decisions about cropping practices in order to reduce environmental damage without reducing profits.
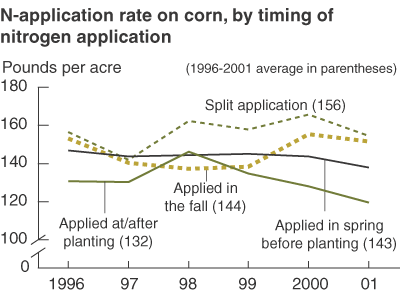
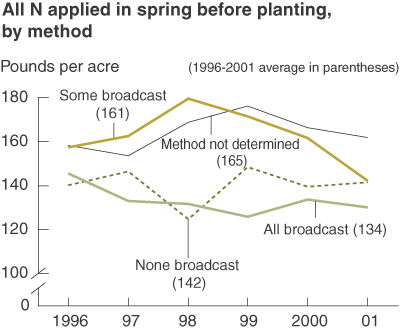
N-application rates are even more variable when timing and method of application are considered. Timing and method of application in turn are influenced by a variety of factors, including weather. Spring application before planting was the most common. The next most common timing options were split application and application at or after planting. On fields where all nitrogen was applied at or after planting, N-application rates averaged about 12 pounds less than on fields where nitrogen was applied either exclusively in the spring before planting or in the fall. Application rates in the spring before planting were lowest when all nitrogen fertilizer was broadcast—the most common method of application.
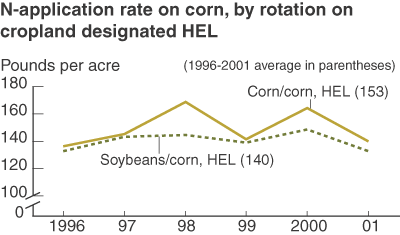
On highly erodible cropland (HEL), N-application rates tend to be lower when corn is planted after soybeans than when corn follows corn, because soybeans can fix (extract) nitrogen from the atmosphere. Thus, corn planted after soybeans requires less nitrogen from commercial fertilizer.
This article is drawn from:
- ARMS Farm Financial and Crop Production Practices. (n.d.). U.S. Department of Agriculture, Economic Research Service.
- Commodity Costs and Returns. (n.d.). U.S. Department of Agriculture, Economic Research Service.


