Behind the Data
- by Howard Elitzak
- 2/1/2004
Calculating the Food Marketing Bill
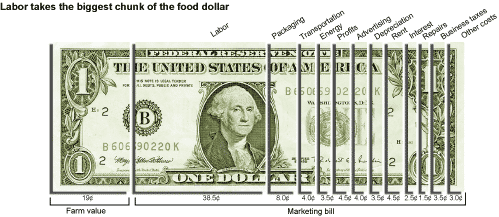
Total consumer spending on food grown and processed in the U.S. was $709 billion in 2002. Nineteen cents of every dollar spent on U.S.-grown food goes to the farmer for the raw food inputs, while the other 81 cents covers the cost of transforming these inputs into food products and getting them to our grocery shelves and lunch counters. ERS tracks these processing and distribution costs by calculating what consumers spend for U.S.-grown food each year, and then subtracting the farm value (what farmers were paid) to derive the “marketing bill.”
Retail sales data from the Bureau of Census are used to calculate how much consumers spend on foods purchased in grocery stores and eating establishments. The value of food served by schools, hospitals, and other institutions is also included in these estimates. ERS uses supermarket industry data to exclude spending for imported foods and seafood.
ERS calculates the farm value by multiplying farm prices (from USDA’s National Agricultural Statistics Service) by the quantity of farm products purchased in a given year (from ERS supply and utilization tables). Nonfood byproducts (hides, offals, etc.) are excluded from the farm value estimates.
ERS estimates 11 cost components of the marketing bill. Labor, the largest component, includes wages and salaries of employees, earnings of owners and proprietors, and employee benefits. ERS calculates labor costs using payroll data from the Bureau of the Census and the Bureau of Labor Statistics. Packaging (the second largest component) and energy costs are calculated from Census data. The remaining cost components are derived from Internal Revenue Service statistics.
The size of the marketing bill is affected by changes in the amount and type of products consumers buy. For example, restaurant meals have more marketing costs associated with them, and are therefore more expensive than foods at grocery stores. So, as consumers spend more at restaurants, the marketing bill increases in value. Similarly, as consumers purchase more highly processed food products, such as microwave-ready dinners, relative to less processed fruits, vegetables, and meats, the value of the marketing bill increases. Over the last two decades, the marketing bill has increasingly taken a larger share of the consumer food dollar, growing from 73 percent of consumer food spending in 1982 to 81 percent in 2002.
| Expenditures | 1980 | 1990 | 2000 | 2002 |
|---|---|---|---|---|
| Labor | 81.5 | 154.0 | 252.9 | 273.1 |
| Packaging materials | 21.0 | 36.5 | 53.5 | 56.8 |
| Rail and truck transportation | 13.0 | 19.8 | 26.4 | 28.4 |
| Fuels and electricity | 9.0 | 15.2 | 23.1 | 24.9 |
| Pretax corporate profits | 9.9 | 13.2 | 31.1 | 33.0 |
| Advertising | 7.3 | 17.1 | 26.1 | 28.1 |
| Depreciation | 7.8 | 16.3 | 24.2 | 25.3 |
| Net interest | 3.4 | 13.5 | 16.9 | 19.2 |
| Net rent | 6.8 | 13.9 | 26.7 | 30.3 |
| Repairs | 3.6 | 6.2 | 10.1 | 10.9 |
| Business taxes | 8.3 | 15.7 | 23.5 | 24.9 |
| Other costs | 11.1 | 22.2 | 23.3 | 22.0 |
| Total marketing bill | 182.7 | 343.6 | 537.8 | 576.9 |
| Farm value | 81.7 | 106.2 | 123.3 | 132.5 |
| Consumer expenditures | 264.4 | 449.8 | 661.1 | 709.4 |
This article is drawn from:
- Food Markets & Prices. (n.d.). U.S. Department of Agriculture, Economic Research Service.


